Overview of the Projects
To explore GIS and build practical skills during this Summer Course, I completed six assignments, each targeting a specific learning goal and utilizing various tools such as GIS, ArcGIS, QGIS and Esri Online. Here is an overview of the six maps from these assignments. Additionally, I have included a page showcasing the work I did a few weeks ago in my previous summer course on Environmental Health.
Chloropleth Map
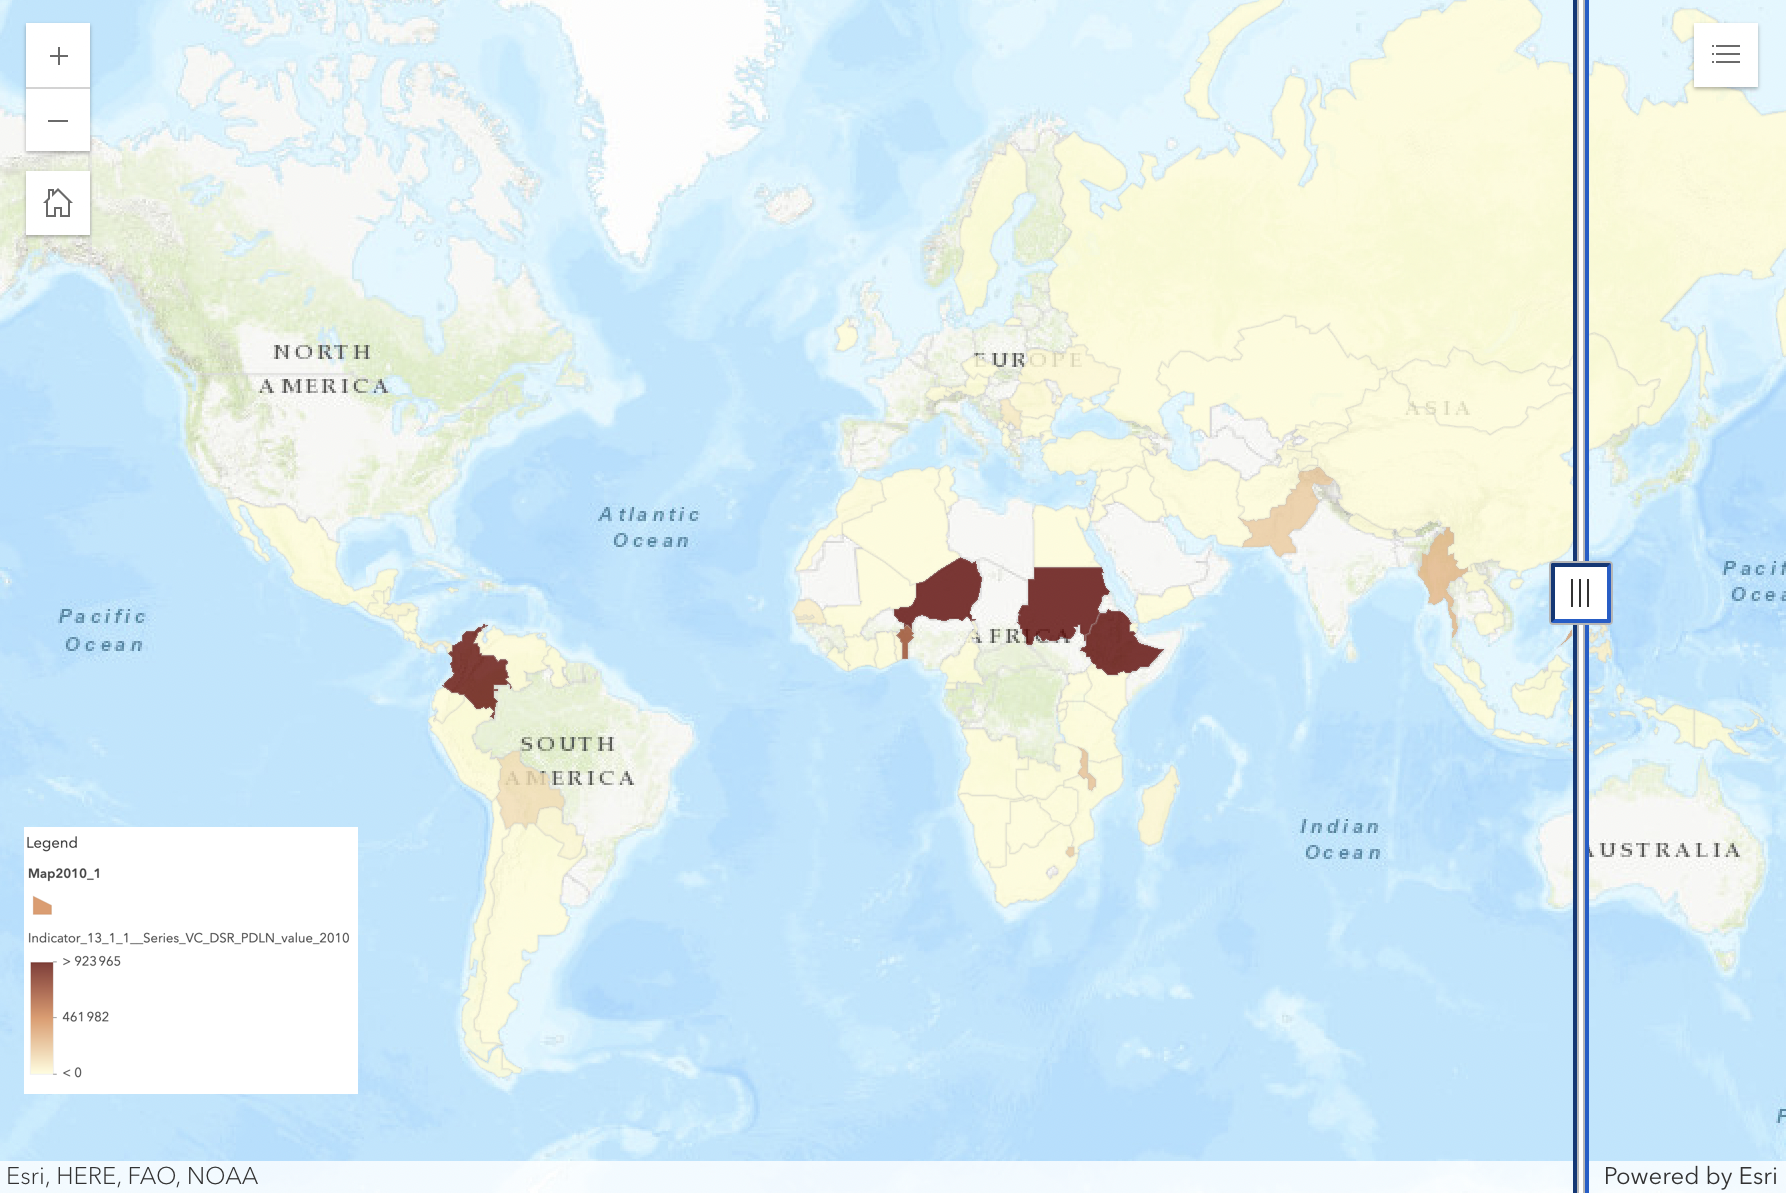
This assignment involved creating a choropleth map using open-source SDG data to illustrate indicator 13.1.1, which tracks the number of people whose livelihoods were disrupted or destroyed by disasters. I chose to focus on this indicator for the years 2010 and 2020 to compare changes over a decade.
Vector Analysis
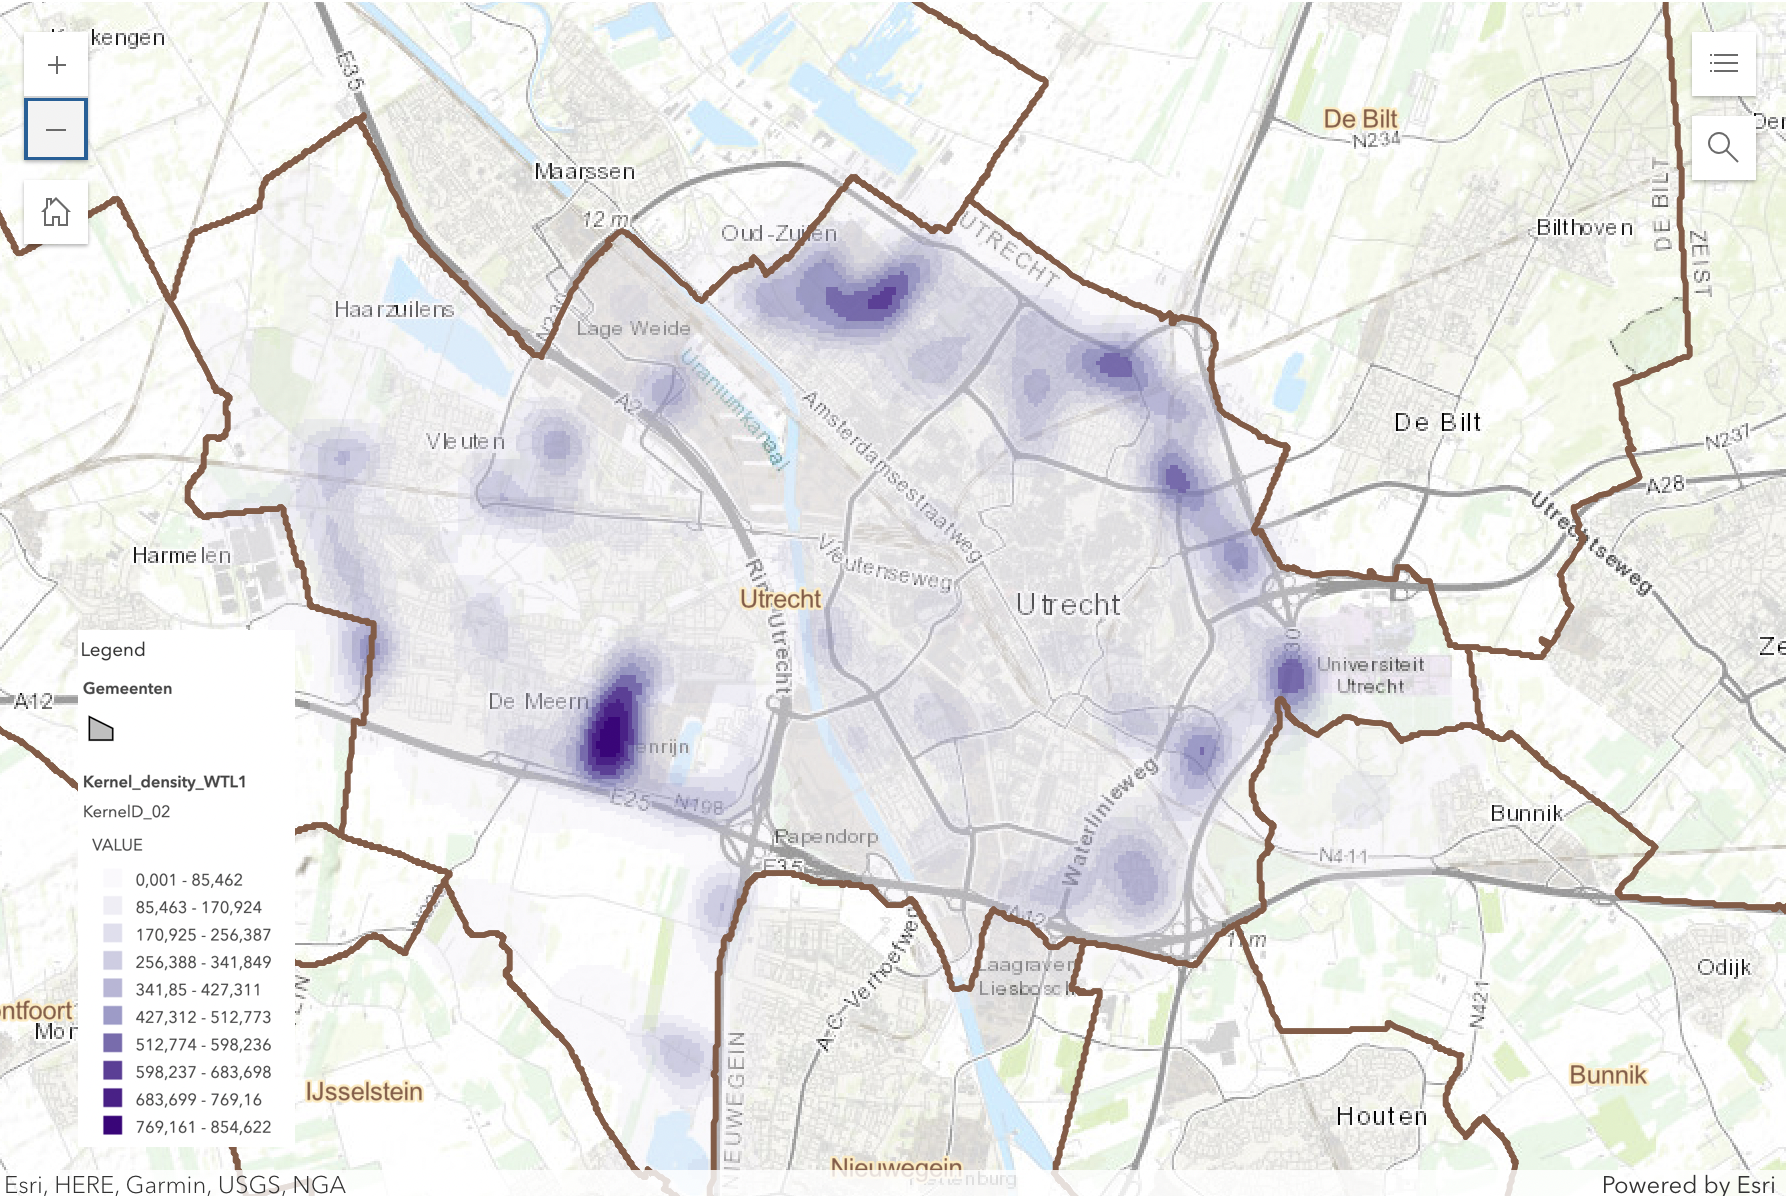
This assignment consisted of analyzing the density and dispersion of trees in Utrecht using ArcGIS. I used data from the Gemeente Utrecht, the municipality, focusing on the species Fraxinus (ash tree).
Land Cover Classification
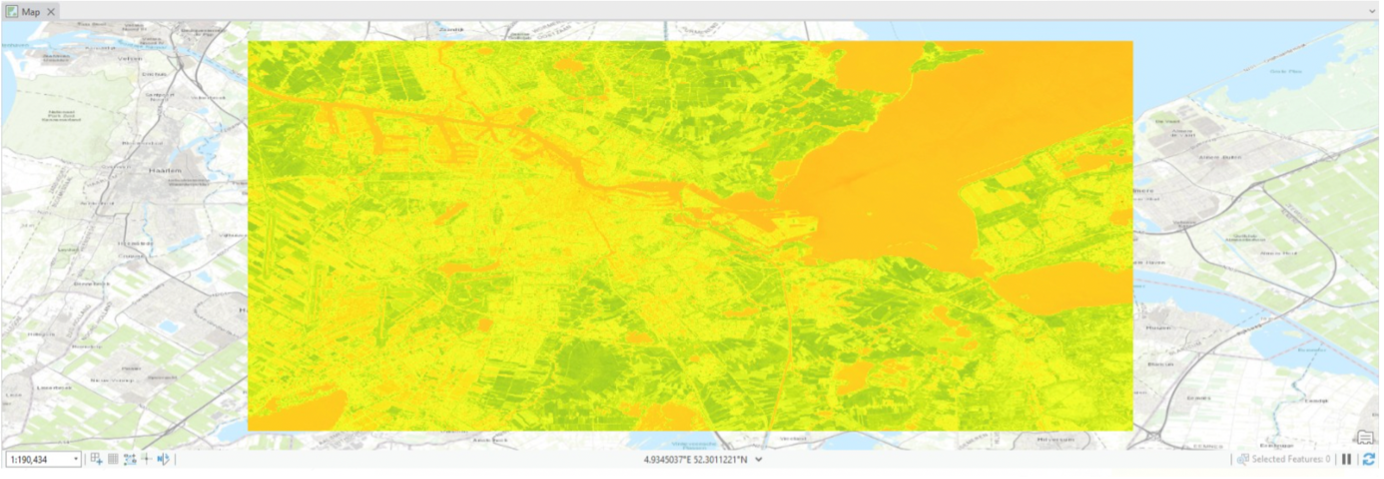
For the third assignment, I explored various types of classifications. I utilized data from Google Earth Engine from Amsterdam in May and June 2024, importing it into ArcGIS. I generated different maps using different classification methods to determine the most suitable approach.
Map 4
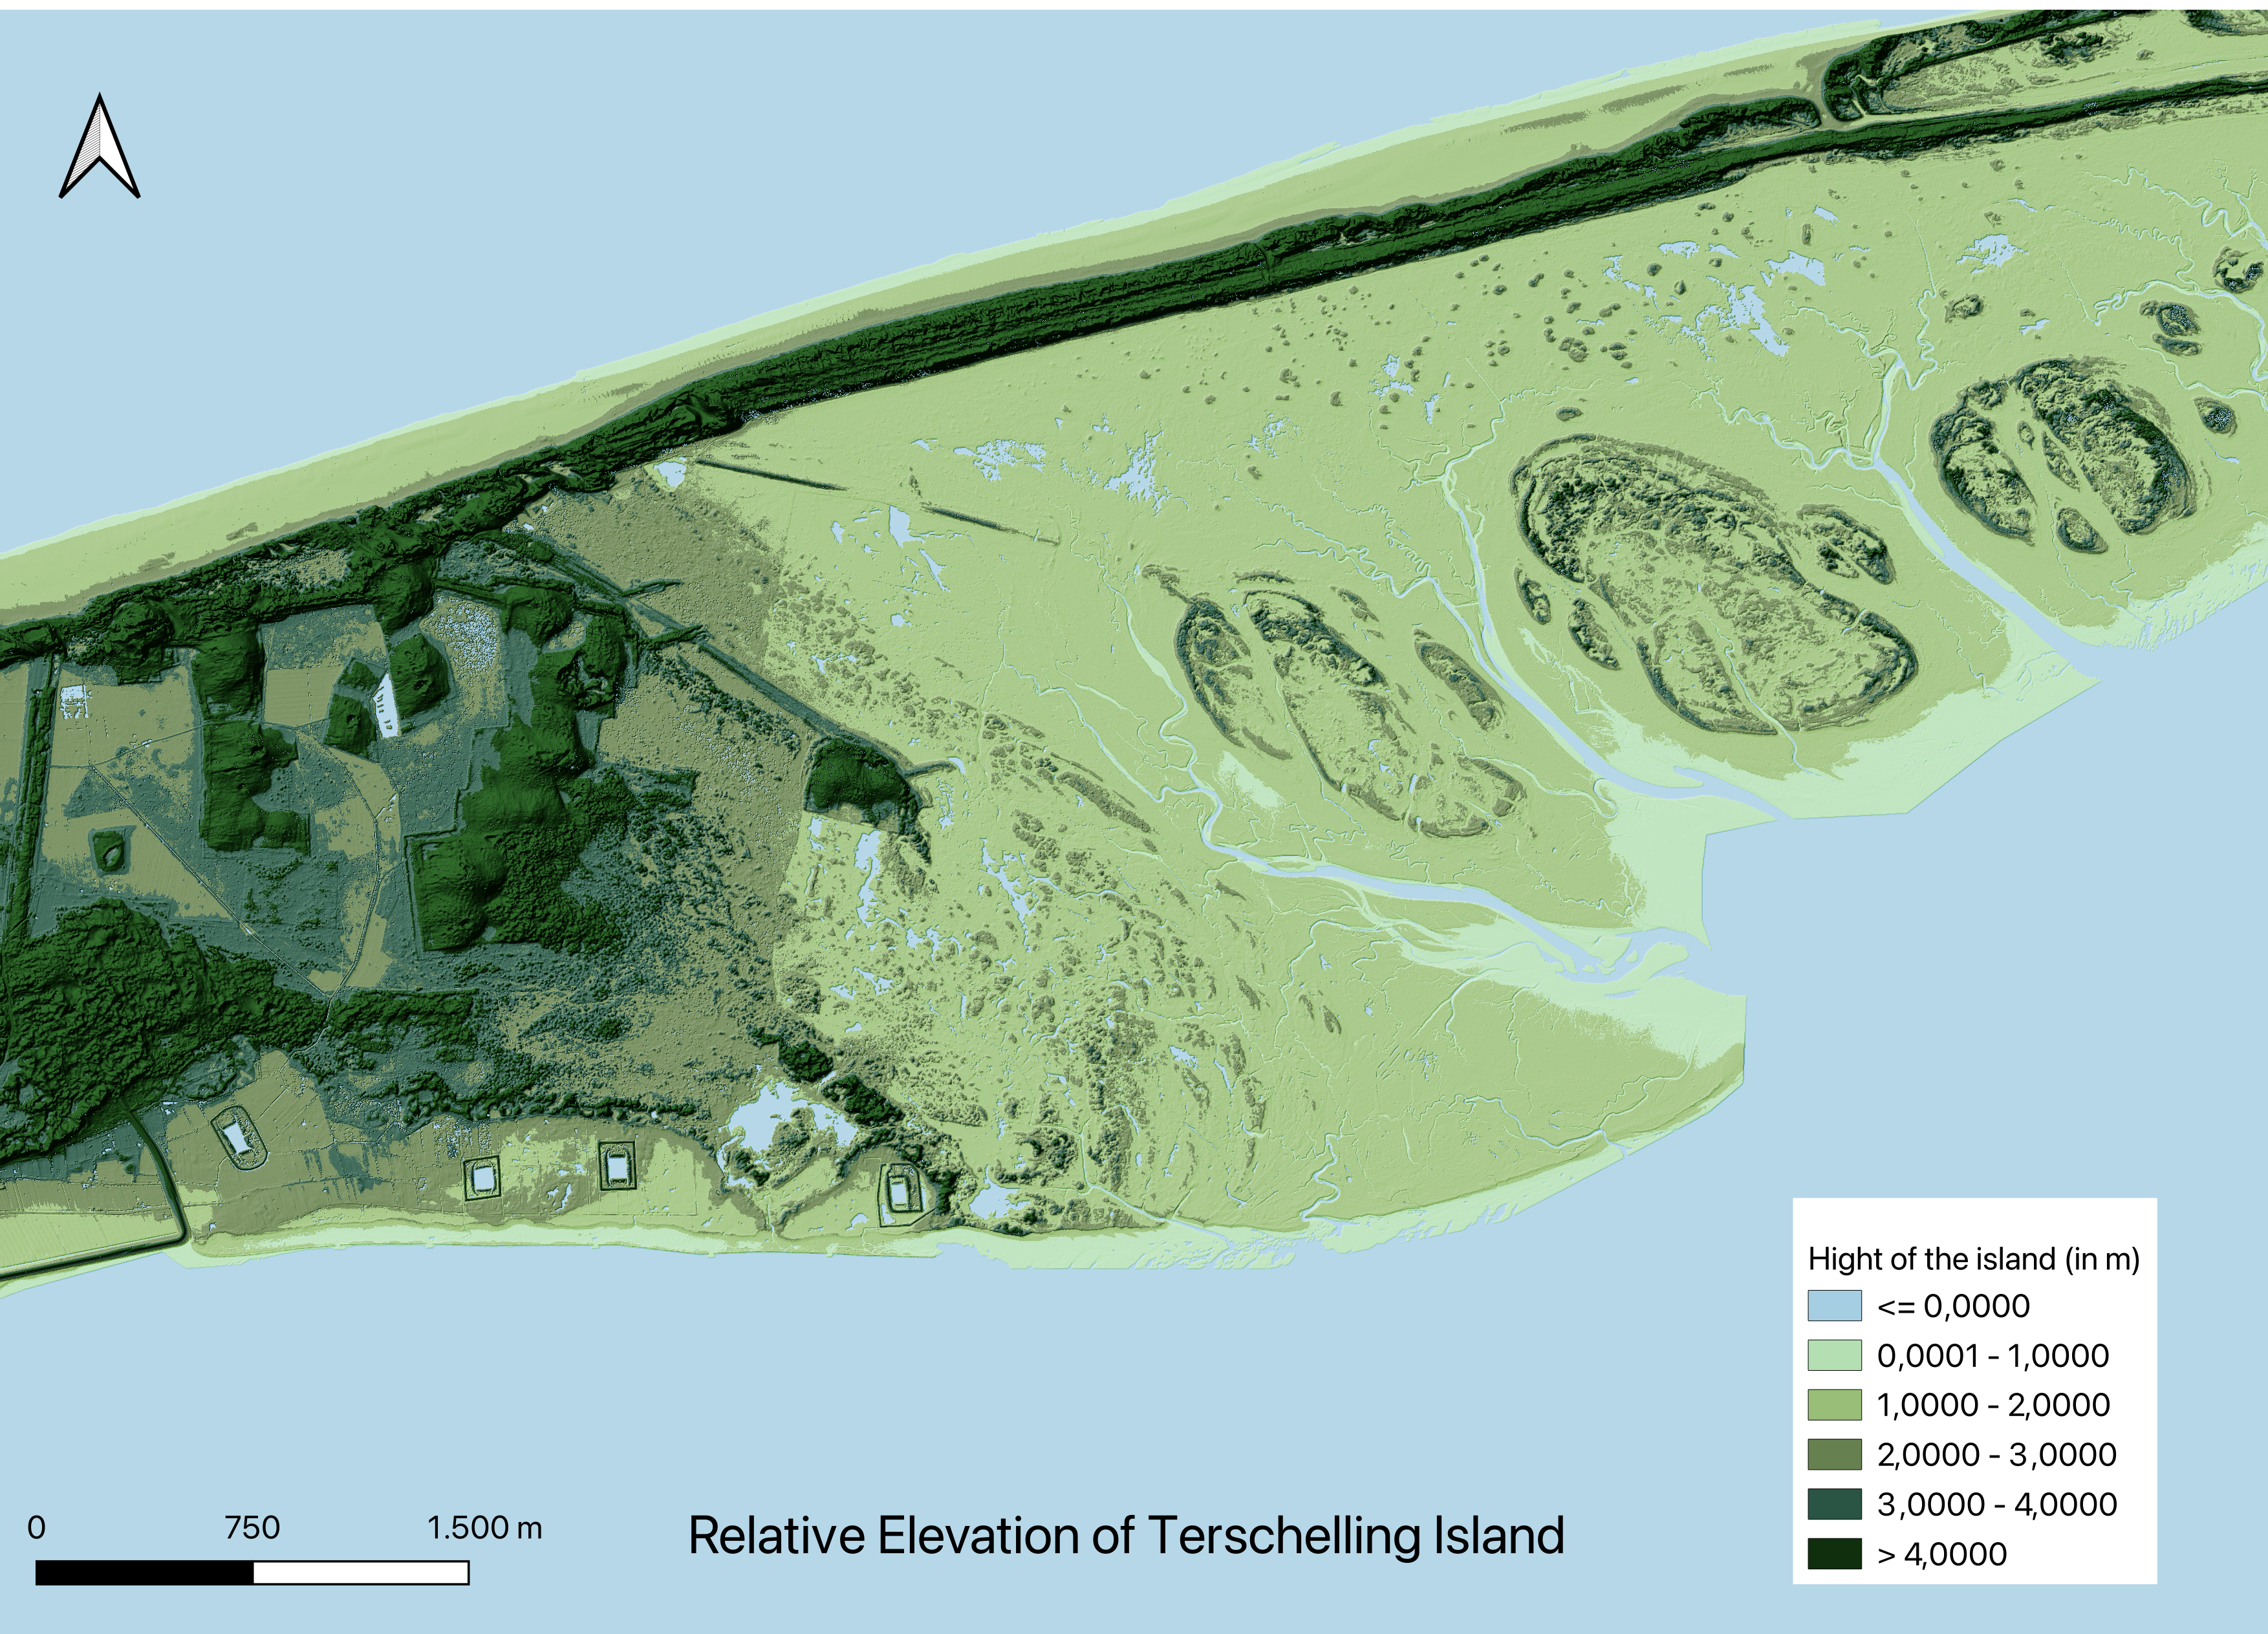
In this assignement I used GeoTiles data to map the Dutch Island Terschelling and analyze the relative elevation of the islands.
Map 5
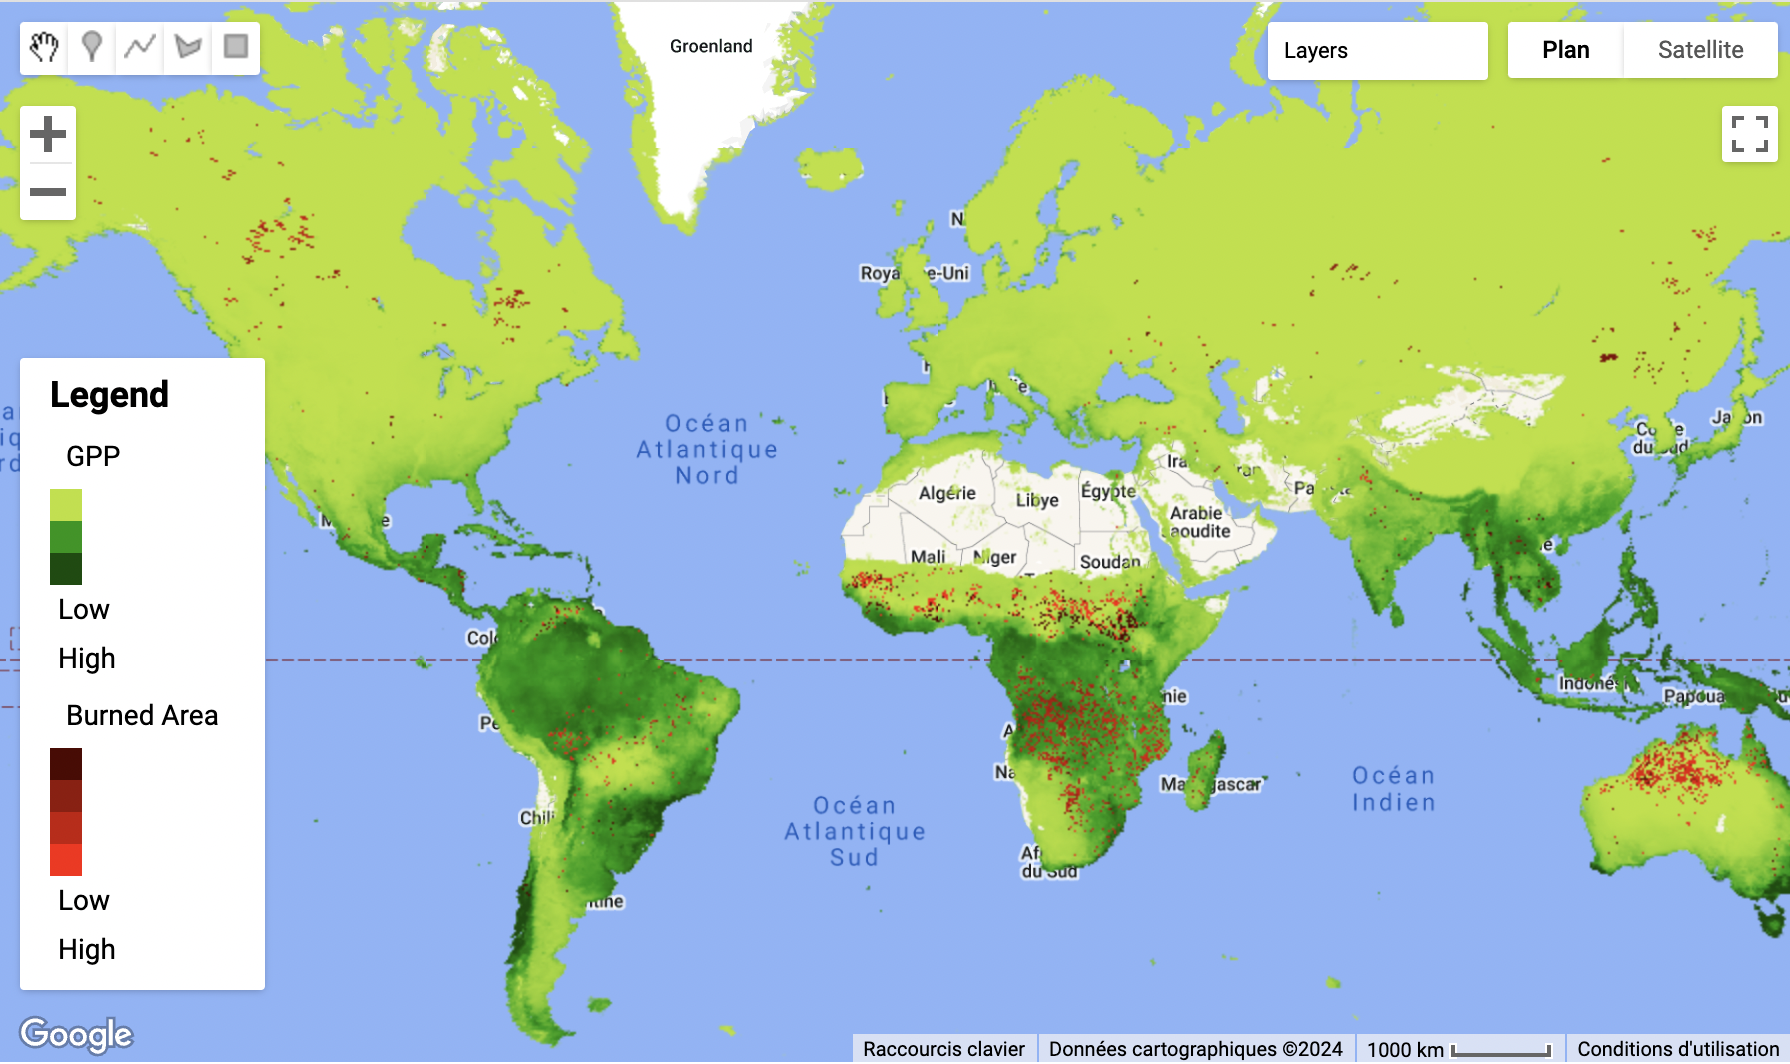
For this project, I used datasets from the Google Earth Engine Data Catalog to create a map that highlights forests and their exposure to fires.
3D Map Portland, US
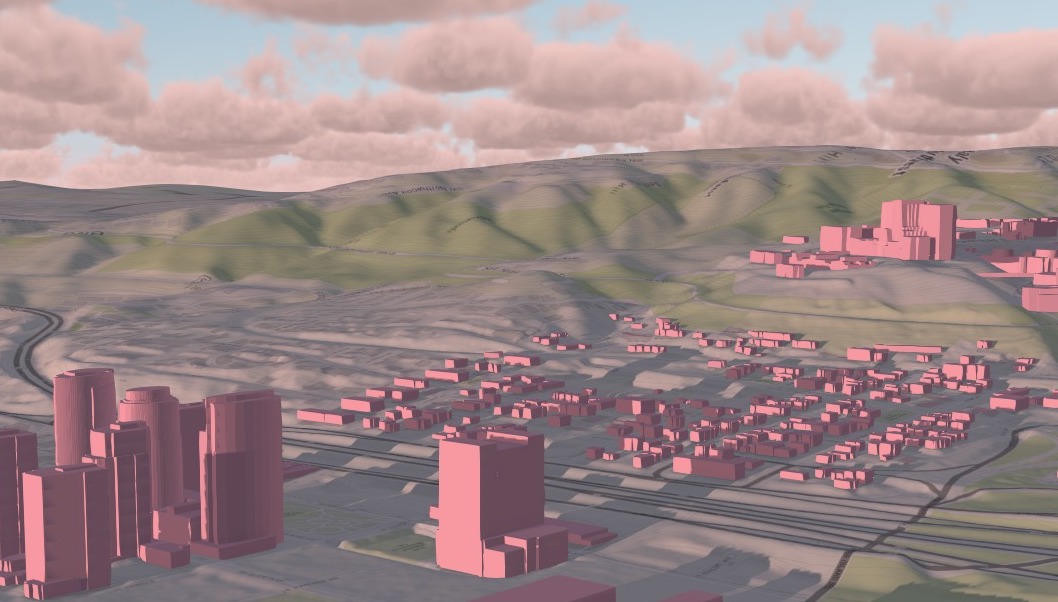
I created this 3D map of Portland using a global projection scene by following the ESRI tutorial on Sharing 3D Content Using Scene Layer Packages.
NO2 analysis
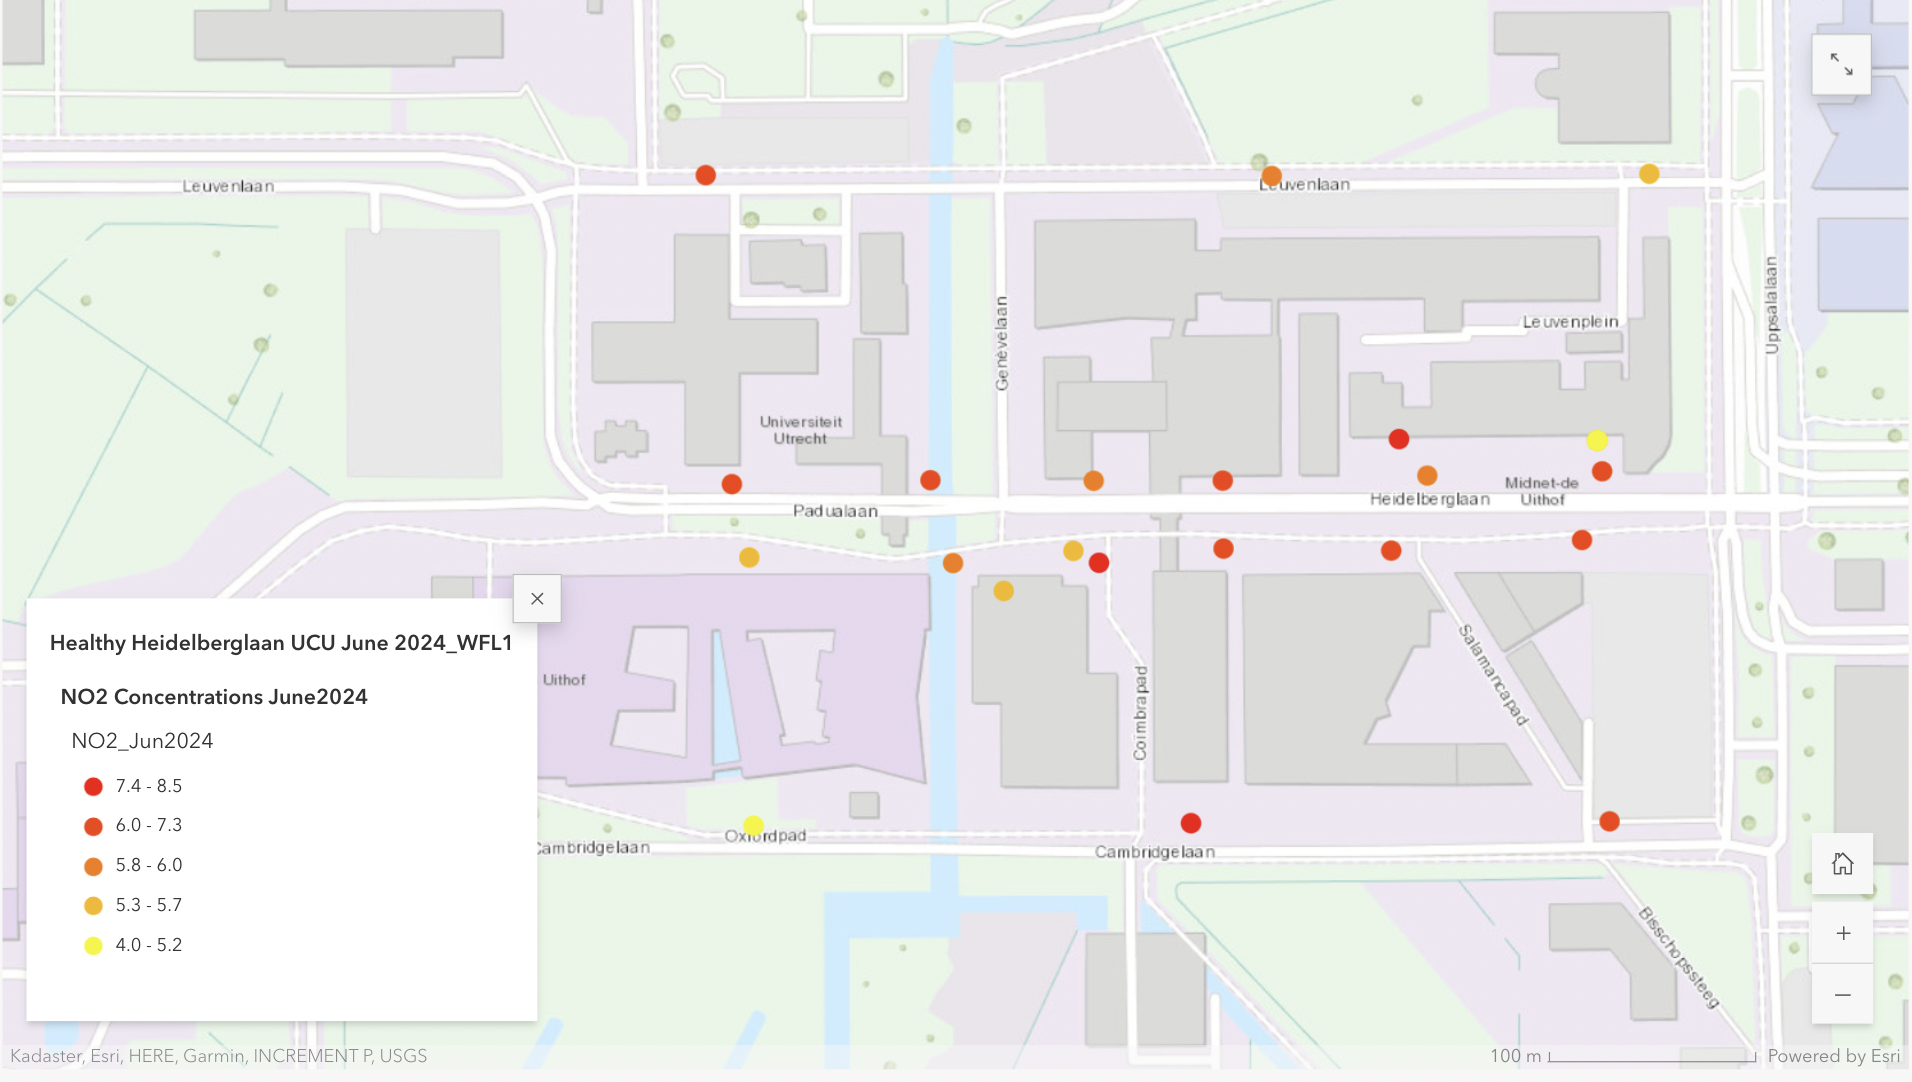
During my first Summmer Course on the topic of the Environmental Health , we monitored NO2 pollution on Science Park's main roads. This data aims to inform future redevelopment for healthier urban living. The course collects data to support decision-making for improving Utrecht Science Park.